


IBM ELM Monitoring

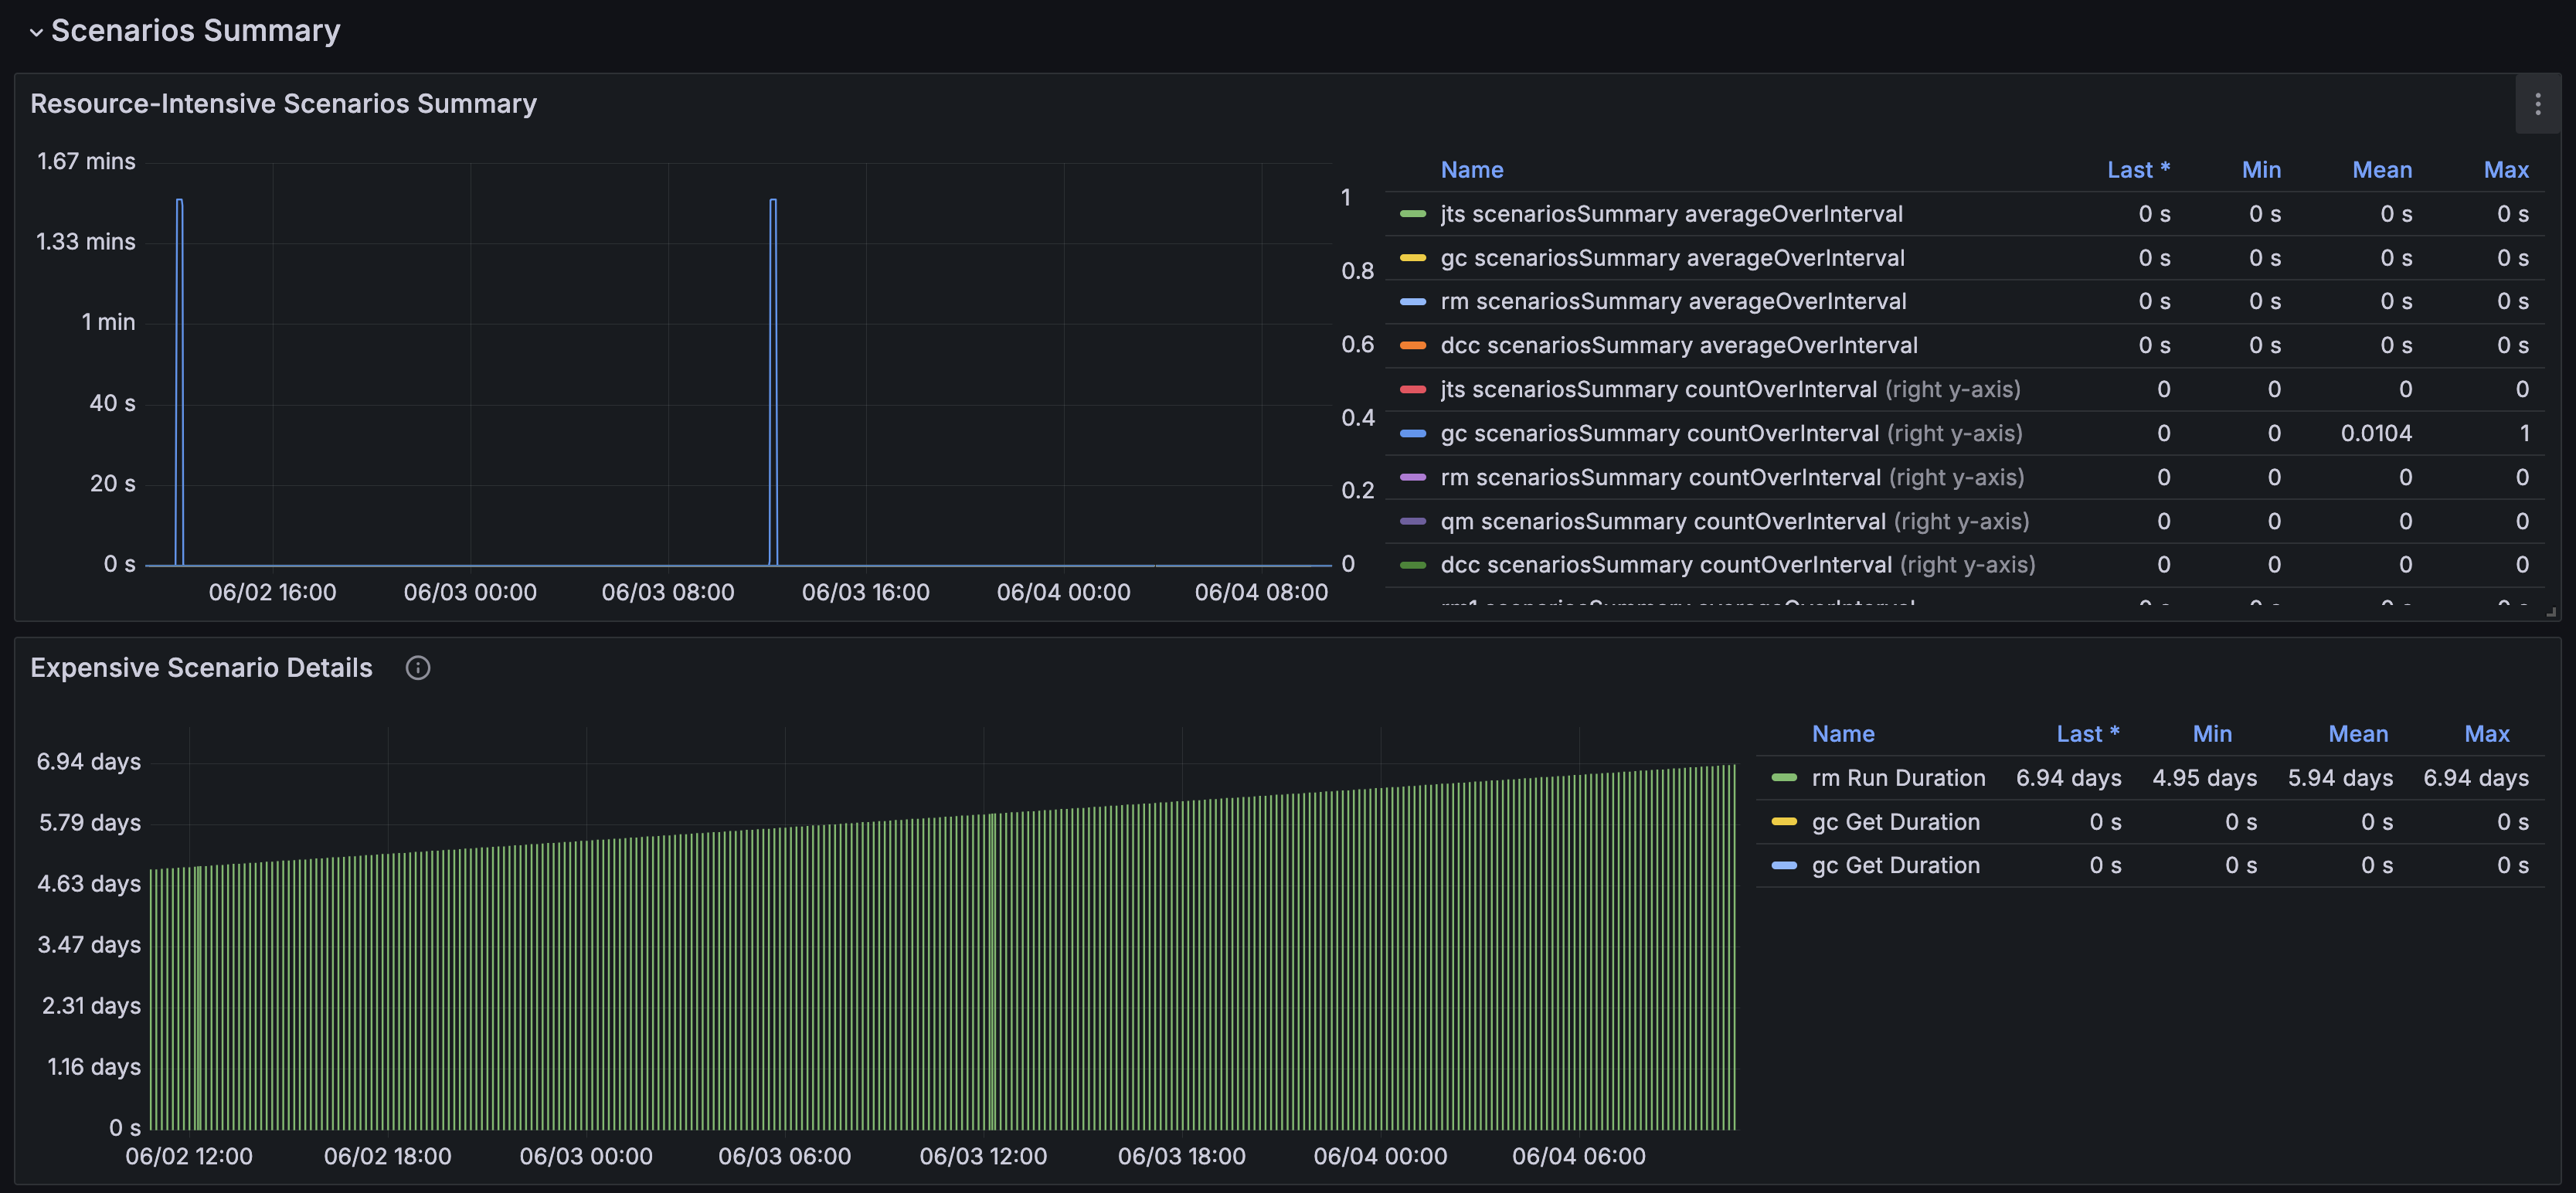
Softacus configures monitoring for IBM ELM applications and their infrastructure. Its Zabbix-based approach can use Grafana dashboards to make application status, resource use and selected operational conditions visible to the responsible teams.
About this offering
Turn operational signals into actionDefine monitoring coverageInputs and service outputsScope and responsibilitiesCommon questionDiscuss your monitoring scope
Turn operational signals into action
Give ELM administrators and infrastructure operators a view of agreed application and infrastructure conditions. Softacus uses a Zabbix-based approach, with Grafana available for dashboard visualisation.
Define monitoring coverage
- Choose the signals. Select resource use, connectivity, application status and relevant licence conditions.
- Set the thresholds. Agree dashboards, severity levels and notification recipients.
- Assign the response. Define who investigates alerts and how issues are escalated.
Inputs and service outputs
Provide the deployment architecture, monitoring access requirements and operational priorities. Agree the monitored metrics, dashboards and alert configuration, plus checks to confirm that selected conditions produce the intended notification.
Scope and responsibilities
Monitoring and notifications do not define incident-response coverage on their own. Confirm operational ownership, support terms and any managed response in the proposal. Zabbix and Grafana remain third-party tools.
Common question
Does an alert automatically fix the issue? The documented approach notifies administrators. Any automated action or managed response requires its own agreed scope.
Discuss your monitoring scope
Share your ELM setup, existing tools, main concerns and the team that should receive and act on alerts.
Related options to compare
- Diagnostic Check — Compare scheduled application diagnostic emails with dashboard and infrastructure monitoring.
- SELMA — Discuss broader managed operations when monitoring needs an agreed service owner.
These are editorial suggestions for related scenarios; they do not imply a shared licence or a product integration.
